KL
Reviewed Oct 27, 2020
Very helpful and easy to follow. There are a couple of statistical terms used that weren't explained so google is your friend in those cases
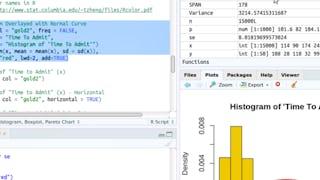
Welcome to RStudio for Six Sigma - Basic Description Statistics. This is a project-based course which should take approximately 2 hours to finish. Before diving into the project, please take a look at the course objectives and structure. By the end of this project, you will learn to perform Basic Descriptive Analysis (Six Sigma) tasks hands-on using RStudio. Both R language and RStudio tools are Open Source and can be used for most Six Sigma analysis tasks without needing commercial software.
KL
Very helpful and easy to follow. There are a couple of statistical terms used that weren't explained so google is your friend in those cases
VH
very good course for learning R Studio IDE and descriptive statistics through R
EE
Nice course with good hands on practical teachings of some of the basic parts of R. It sets the tone for mastery in R. Great resource
KS
Love the approach. The script you leave the course with is an excellent foundation toolkit for using the skills at work.
AS
Learnt something I didn't Know. Thanks for making it easy too
Showing: 12 of 12
Love the approach. The script you leave the course with is an excellent foundation toolkit for using the skills at work.
Very helpful and easy to follow. There are a couple of statistical terms used that weren't explained so google is your friend in those cases
very good course for learning R Studio IDE and descriptive statistics through R
Great course and teacher!
Informative and Concise.
All good.
good
good
Nice course with good hands on practical teachings of some of the basic parts of R. It sets the tone for mastery in R. Great resource
Learnt something I didn't Know. Thanks for making it easy too
best
Instructor promises that we will get a link to download the data and script. Link to course material does not work as expected. Takes you to a place where the free storage for the files has expired. The only way to get the files is by enrolling in a PAID SUBSCRIPTION. This issue was reported in the course user forum a month ago. No response by anybodo so far. Best for students who have taken some trainnig in R and the RStudio environment. If you don't know much about either and then try his techniques, you may get very frustrated. And again, can't do it on your own once you leave the course, unless you want to pay a subscription to some hosting company.